Understanding EEG: The Fundamentals
This is a series documenting a personal project: building a non-invasive EEG signal acquisition device from scratch. The idea that the brain is the most complex network and that nobody has ever fully decoded it has always fascinated me. I certainly cannot solve that mystery in this lifetime. But I can try to understand a small part of it. This project is a step in that direction.
There are some excellent EEG systems already available to buy. And buying one would definitely be easier than building one. But this project was never just about collecting EEG data. I wanted to understand what actually happens at every step, from a neuron firing inside the brain to a waveform showing up on a screen. Instead of treating an EEG device as a black box, I decided to build one end-to-end and understand every layer along the way.
This phase of the project focuses on building a device capable of acquiring clean EEG signals. This article is where it starts – laying the groundwork. Before building anything, it's worth understanding what EEG actually is, why it works at all, and what limitations come with it. That's what the rest of this article covers.
A Brief History of EEG
To build some context for what EEG is, it helps to know a brief history of where it came from. The idea that the brain runs on electricity has been known for far longer than most people think.
It all started in 1791, when Luigi Galvani made a dead frog's leg twitch with an electrical spark. He showed that nerves and muscles respond to electrical current. His experiments proved that living tissue could generate and conduct electricity. After this demonstration, nobody connected that idea to brain activity for almost a century. Then in 1875, Richard Caton became the first to record faint electrical signals directly from an exposed animal brain using electrodes. Even though his work was primitive, it was the first real evidence that the brain continuously generates electrical activity.
Now that we knew that the brain generates electrical signals, the next challenge was to record those signals without opening the skull. Vladimir Pravdich-Neminsky made it happen in 1912. He captured the first electrical recording from the brain of an intact dog. Just over a decade later, in 1924, Hans Berger did the same in a human for the first time – placing electrodes directly on the scalp and recording the electrical activity. That recording is what we now commonly call an EEG, short for electroencephalogram.
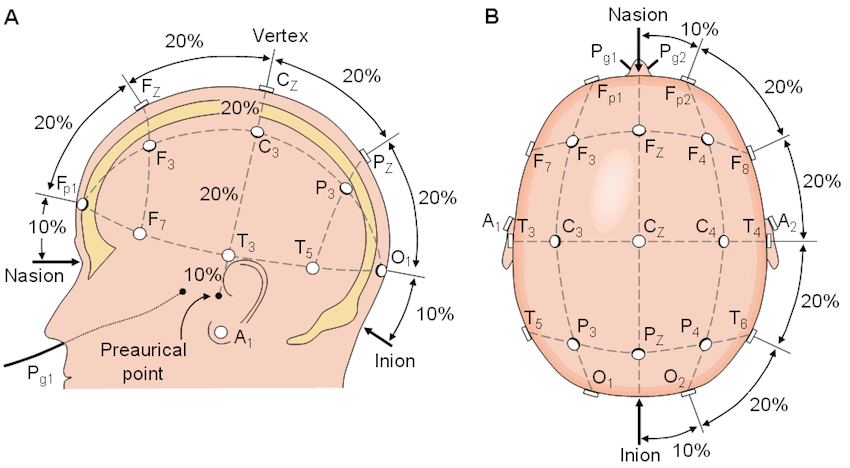
Once that idea worked, making it useful was the harder problem. From the 1930s through the 1950s, EEG systems recorded brain activity with ink pens that continuously wrote onto long rolls of moving paper. Physicians read and interpreted those traces directly. However, every lab placed electrodes in slightly different spots, making it impossible to reliably compare recordings across labs. That changed in 1958, when Herbert Jasper solved the problem by introducing the 10-20 system – a standardized map for where electrodes go on the head, which remains the standard used to this day.
The last major shift was digitizing EEG recordings. Through the 1980s and 90s, EEG transitioned from paper recordings to digital signals captured on a computer which made it easier to store, replay, and analyze them. That's really what made a project like this possible today. What once needed trained professionals and sophisticated equipment can now be built relatively easily at home using commercially available components, and open-source software.
What EEG Actually Is
Before building an EEG system, it's worth answering a simple question:
What exactly are we trying to measure?
Every thought the brain produces is, at bottom, electricity. Neurons communicate by transmitting tiny electrical signals to each other. Those electrical pulses are incredibly small and localized for individual neurons. But when large populations of neurons become active together, their combined activity produces a strong enough signal. This signal can be detected from outside the skull using electrodes placed on the scalp.
That's what electroencephalography (EEG) is: a non-invasive technique for recording the combined electrical activity of millions of neurons firing at once. You might expect that the combined voltage from millions of neurons would be huge. In reality, it's the opposite. By the time signals reach the scalp, they have been reduced to just a few microvolts.
The brain sits behind many layers. There's protective membrane, cerebrospinal fluid, solid bone, and finally skin. That's a lot of layers standing between the brain and electrodes. Given how well protected the brain is, it's worth asking:
How does any of that signal make it all the way to the scalp?
The answer is that electricity doesn't stop abruptly at the edge of the brain. When a large group of neurons becomes active together, the resulting electrical field spreads outward through the surrounding tissue. Every layer weakens the signal and blurs it a bit more. But some of it reaches the scalp and shows up as a tiny voltage that can actually be detected.
This explains EEG's biggest strength and biggest weakness. Because the electrodes never touch the brain, EEG is safe, inexpensive, and can be used repeatedly. But that comes at the cost of precision. By the time the signal reaches the scalp, it has been smeared across a fairly wide area. Each electrode therefore captures activity from a relatively broader region of cortex rather than a single precise location.
In other words, EEG is great at telling when an activity happens in the brain. But it's much worse at telling exactly where that activity originated. Which raises another question:
If putting electrodes closer to the brain gives a cleaner signal, why not just do that instead?
The short answer is: sometimes people do exactly that. Getting closer to the brain does give a cleaner signal. But it comes with its own limitations. Every method for recording brain activity trades off signal quality against safety, cost, and practicality. The right choice depends entirely on the application. Broadly speaking, brain activity can be recorded in three different ways, depending on where the electrodes are placed relative to the brain.
At one extreme, electrodes are placed directly into brain tissue – invasive recordings. These intracortical recordings give extraordinary precision, sometimes even capturing the activity of a single neuron. However, these involve brain surgery and carry significant medical risk which limits their use to specialized medical and research settings.
At the other extreme is placing electrodes on the scalp, which requires no surgery at all – non-invasive recordings. This is what EEG uses. The signal is weaker because it has to pass through several layers of tissues. But it's safe, cheap, portable, and can be used repeatedly without surgery.
Between these two extremes sits a semi-invasive recording method: ECoG (electrocorticography). Instead of going into the brain, electrodes sit on its surface, just under the skull. It skips the skull's blurring effect entirely, so the signal is cleaner and more precise than EEG. But it still requires surgery.
The pattern is simple. The closer you get to the brain, the better the signal – but the more invasive, risky, and impractical it gets.
Why EEG for This Project?
Invasiveness is just one of the factors these methods differ on. Some techniques don't even use electrodes at all. MEG measures the brain's activity through the tiny magnetic fields it produces. fMRI doesn't measure electrical activity at all. Instead, it tracks changes in blood flow as an indirect measure of where neurons are active. Each method balances spatial precision, timing precision, cost, and practicality differently.
| Method | Invasiveness | Spatial Precision | Timing Precision | Cost / Portability |
|---|---|---|---|---|
| EEG | Non-invasive | Low | Very high (ms) | Low cost, portable |
| MEG | Non-invasive | Moderate | Very high (ms) | Very high cost, large equipment |
| fMRI | Non-invasive | High | Low (seconds) | Very high cost, large equipment |
| ECoG | Semi-invasive | High | High | Requires surgery |
| Intracortical | Invasive | Very high | Very high | Requires surgery |
Each of these methods is genuinely good at something. If the goal were single-neuron precision, intracortical recording would win easily. If the goal were pinpointing exactly where in the brain something happened, ECoG or fMRI would be better choices.
But for a personal hardware project, non-invasive recording is the practical choice – a device that is safe, portable, and affordable without requiring a surgical team or specialized facilities. Of all these options, EEG is the one that fits this project.
Electrode Placement: The 10-20 System
So EEG electrodes sit on the scalp, not on the brain itself. That raises the obvious next question: If the electrodes aren't touching the brain itself, how do we know where to place them?
The answer starts with understanding a little bit of anatomy. EEG mostly picks up activity from the cerebral cortex. It is the brain's thin outer layer, and the part closest to the scalp. It's the biggest contributor to the signals that make it through the skull and reach the scalp. That's why electrode placement is based on cortical anatomy.
A Quick Map of the Brain
The brain has two halves called hemispheres, left and right. They are connected by a thick bundle of nerve fibers called the corpus callosum. The two sides constantly pass information back and forth through these fibers. Motor and sensory control are largely cross-wired. The left hemisphere handles movement and sensation on the right side of the body, and the right hemisphere handles the left. Almost every real-world task – thinking, moving, remembering, or perceiving – involves both hemispheres working together.
Each hemisphere splits further into four lobes:
- Frontal lobe – behind the forehead. It handles planning, decision-making, voluntary movement, and language production.
- Parietal lobe – near the top and back of the head. It processes touch, temperature, pain, and integrates input from different senses.
- Temporal lobe – roughly behind the ears. It handles hearing, language comprehension, and memory.
- Occipital lobe – at the very back. It mostly handles vision.
These are not isolated modules and do not have a defined boundary. Most of the everyday tasks pull in multiple lobes at once. But this simplified map is enough to understand electrode placement.
The 10-20 System
Anatomy gives a rough estimate of where things are, but building a device needs something more precise than "somewhere near the front." Herbert Jasper developed the 10-20 system that solves this exact problem. He designed a standard way of placing EEG electrodes so recordings from different people and different labs can actually be compared.
Instead of relying on fixed electrode locations, it uses two landmarks on the head: the Nasion (between the eyes) and the Inion (the bony bump at the back of the skull). He built a relative system by placing electrodes at 10% and 20% intervals of the distance between the two landmarks. Since the distances are defined as percentages rather than fixed lengths, the layout scales across different head sizes.
Each electrode's name tells where it sits. The letter tells the lobe: Fp for frontopolar, F for frontal, C for central, P for parietal, T for temporal, O for occipital. And the number tells the side – odd on the left, even on the right, and z marks the midline. F3 sits over the left frontal region, F4 over the right, and Fz is right between them.
Denser setups, like the 10-10 or 10-5 systems, just add more electrodes in between using the same naming logic.
EEG Frequency Bands
After understanding electrode placement, the next important thing is learning how to interpret the recorded signals.
EEG signals are not random. They have rhythms that depend on the brain's physiological and cognitive state. Instead of looking at the raw signal alone and trying to decode the patterns with respect to time, these signals are divided into commonly used frequency bands and analyzed by their frequency content.
The exact cutoffs vary slightly across textbooks and research papers. But the commonly used bands are:
Delta (0.5–4 Hz): Predominantly seen during deep, dreamless sleep.
Theta (4–8 Hz): Associated with drowsiness and memory-related activity.
Alpha (8–12 Hz): Characteristic of relaxed wakefulness, particularly when the eyes are closed.
Beta (12–30 Hz): Appears during active thinking and concentration.
Gamma (30+ Hz): Associated with higher-order processing and sensory integration.
The alpha band is the easiest one to see in action. A clear ~10 Hz rhythm can be observed by recording over the back of the head while sitting quietly with eyes closed. It drops almost instantly when eyes open. It's a classic way to check if an EEG setup is actually working.
However, these bands aren't literal readouts of mental state. More beta doesn't automatically mean someone's concentrating, and alpha showing up doesn't just mean someone's relaxed. Most mental states involve several bands shifting at once – one might dominate others.
From an implementation perspective, these frequencies also guide many design decisions. EEG signals mostly live below about 100 Hz, and a lot of hardware decisions – the analog front-end, filters, and sampling rate – get designed around it. For instance, if gamma activity of up to 80-100 Hz matters, the sampling rate must satisfy the Nyquist criterion, meaning the sampling rate must be at least twice the highest frequency of interest. More on that once we get to the hardware design.
Key Takeaways
A few takeaways from this article that carry forward into the hardware decisions ahead:
- EEG measures the combined electrical activity of large groups of neurons, picked up faintly at the scalp after passing through several layers of tissue.
- EEG trades spatial precision for safety, affordability, and practicality.
- The signal is described in terms of frequency bands that vary with physiological and cognitive state.
- The signal sits in the low-microvolt range. This is why amplification and careful analog design aren't optional.
- EEG activity is mostly concentrated below ~100 Hz. This drives decisions around filtering and sampling rate.
- Electrode placement follows the 10-20 system, built on the brain's basic anatomy.
References
- Niedermeyer, E., & Lopes da Silva, F. H. (2005). Electroencephalography: Basic principles, clinical applications, and related fields. Link
- Purves, D., Augustine, G. J., Fitzpatrick, D., Hall, W. C., LaMantia, A.-S., Mooney, R. D., Platt, M. L., & White, L. E. (2018). Neuroscience. Link
- Sanei, S., & Chambers, J. A. (2007). EEG signal processing. Link